Building an IoT stack on top of Avassa
Edge AI and distributed data streaming are increasing in popularity by the day. In this blog post, we’ll look at how to deploy IoT edge components for capturing sensor data at the edge, aggregate that data and forward it to a central data collector, typically in the cloud or a centralized data center.
An IoT stack blueprint
With this blue-print we illustrate how an open edge container platform in fact gives you a flexible and agile IoT platform. Historically, IoT platforms have been vertical and closed solutions from one vendor. By turning to edge and containers you get a modern way of building IoT solutions. General-purpose CI/CD pipelines let you deploy your applications, mainstream leading AI components can be selected rather than the ones provided by a single IoT platform. See our previous post on edge as your modern IoT platform.
Gathering sensor data at the edge
In most Edge IoT use cases that we come across, there are sensors producing data, and the most common protocols are MQTT, Modbus, and OPC UA.
As it turns out, HiveMQ for Edge supports all these protocols, hence it’s perfect for collecting IoT data for many different sensors.
After gathering data, you, of course, have the option of just offloading all of the data to the cloud “as is”. But more commonly, the data format differs between sensors and you consequently might need to harmonize the readings locally. And you have many sensors, you also need to decide whether all readings should go to the cloud or do you want to aggregate data first?
Temperature gathering, aggregation and shipping
The illustration below shows the main components in our IoT container blueprint.
To the left at the “Sites” we have the distributed IoT components
- Sensors producing data over IoT protocols.
- MQTT broker that will collect data over the protocols.
- A local edge application that acts on the data. This could be a trained ML model. Containers are the optimal artifact to deploy as ML models.
This article shows how to deploy this solution to a number of sites.
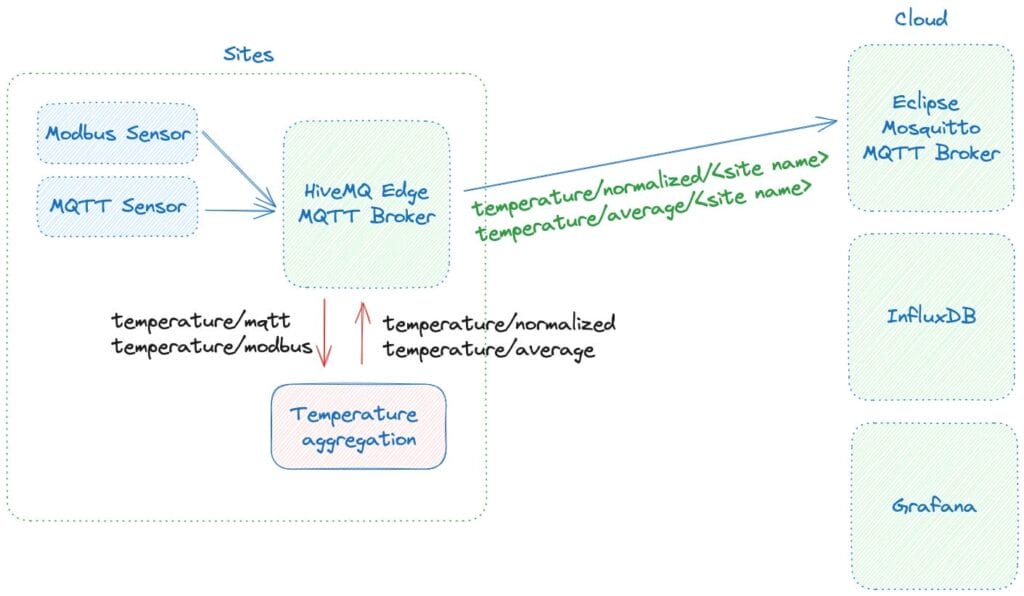
For the central cloud-based portion we use an MQTT broker; the Eclipse Mosquitto, to collect the edge sensor data. We have also set up Influx DB with Telegraf to gather time series data from Mosquitto. Finally, we Grafana to render the data. Grafana and InfluxDB are of course not necessary.
Now let us turn back to edge sites.
On each site, the MQTT sensors are configured to push to a topic called temperature/mqtt. HiveMQ is also configured for gathering data from the modbus sensors and publishing those readings on a topic called temperature/modbus.
I.e., MQTT sensor data is pushed into HiveMQ while modbus data is actually pulled by HiveMQ and stored on a local topic.
HiveMQ for Edge is also configured to forward certain topics to the central Mosquitto MQTT broker, this is done using a HiveMQ feature called MQTT bridging. MQTT bridging allows for selecting a subset of the local topics and forwarding those to another MQTT broker.
We will show two examples where we listen to sensor data and process them before forwarding:
- Normalizing: pick the raw data from Modbus and MQTT and forward them in a normalized format.
- Aggregating: calculate an average.
The normalized sensor data is forwarded in this example, the format we’ve chosen the following format on the temperature/normalized topic:
{
  "source": "mqtt",
  "temperature": 23.1,
  "timestamp": "2023-11-07T09:27:04+00:00"
}
I.e., temperatures from both MQTT and Modbus will be published on this topic.
The temperature aggregation code also keeps a one-minute average window and publishes averages (every minute) on a topic called temperature/average. This part is to demonstrate a reduction in data. This topic is also forwarded to the Mosquitto MQTT broker. This could also be the result of a trained ML model. (Read our blog on serving Edge AI models.)
Consuming these topics in Mosquitto:
$ mosquitto_sub -h 192.168.0.20 -t 'temperature/normalized/+' -v -u test-user -P password
temperature/normalized/home-cluster {"source":"modbus","temperature":19.3976,"timestamp":"2023-11-13T09:26:35Z"}
temperature/normalized/rh-site {"source":"mqtt","temperature":22.148537,"timestamp":"2023-11-13T09:26:35.864953347Z"}
temperature/normalized/rh-site {"source":"modbus","temperature":20.2744,"timestamp":"2023-11-13T09:26:36Z"}
temperature/normalized/home-cluster {"source":"modbus","temperature":19.5388,"timestamp":"2023-11-13T09:26:36Z"}
temperature/normalized/home-cluster {"source":"mqtt","temperature":23.105782,"timestamp":"2023-11-13T09:26:37.190267899Z"}
And this is what it looks like when rendered in Grafana.
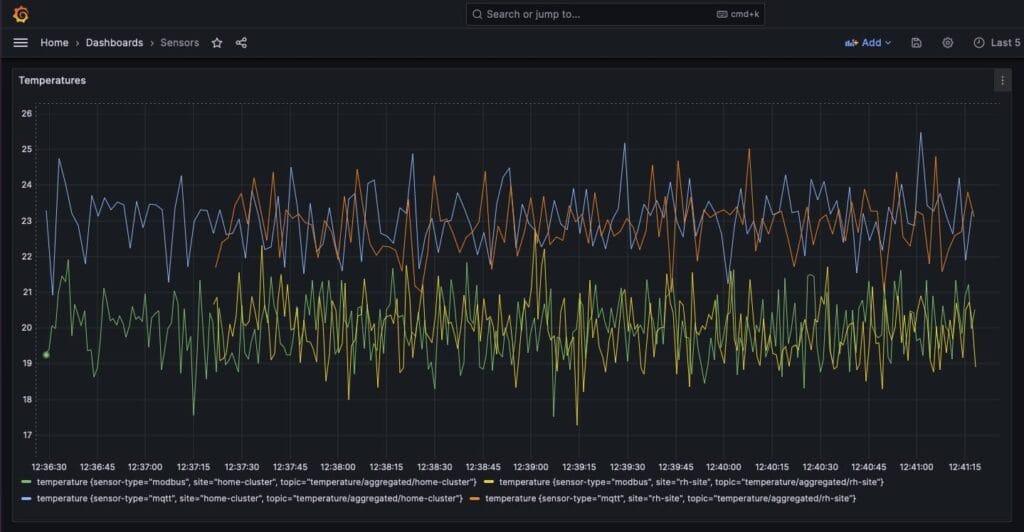
Obviously, with just a few (four in the demo) sensors, a lot of data is generated and forwarded to the cloud, hence some kind of aggregation is in many cases needed.
And the averages:
$ mosquitto_sub -h 192.168.0.20 -t 'temperature/average/+' -u test-user -P password -v
temperature/average/home-cluster 20.020031
temperature/average/rh-site 19.890388
temperature/average/home-cluster 20.066994
temperature/average/rh-site 19.91332
temperature/average/home-cluster 19.928413
temperature/average/rh-site 19.954153
temperature/average/home-cluster 23.121218
temperature/average/rh-site 19.988976
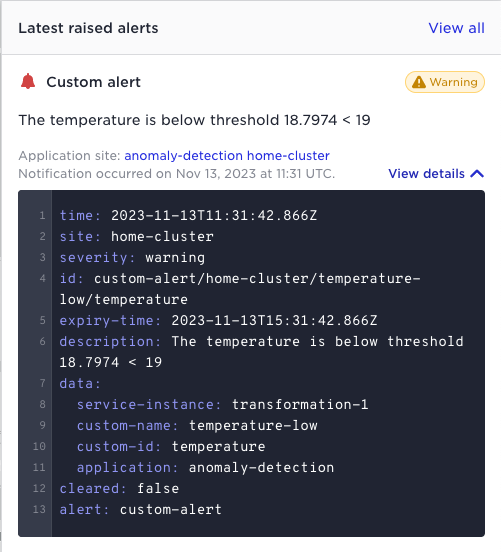
The temperature aggregator also uses an Avassa API that is optionally available to applications, namely the custom alert API (https://avassa-api.redoc.ly/tag/Custom-Alerts). This API allows applications to generate (and clear) custom alerts. In this case, an alert is generated when the temperature falls below a certain threshold.
Conclusion
In this article we have shown how a modern container orchestration platform can give you an agile IoT platform. Standardizing on containers at the IoT edge has many benefits in contrast to a vertical closed IoT platform:
- reuse your CI/CD pipeline and modern software engineering competence
- pick and choose from available container components for protocols, normalizing, aggregation, ML etc
- by enabling containers at the edge you can make the IoT Edge more application centric with local processing and not just a data collector/forwarder