February 2024: Feature releases & highlights
The February releases come with a new dashboard, giving operations an overview of the edge infrastructure and application status.
Dashboard overview
Below, you see a starting point in the dashboard where you have a number of sites. You have also created two application-owner subtenants and assigned a subset of sites to them. Let us walk through each widget in the dashboard.
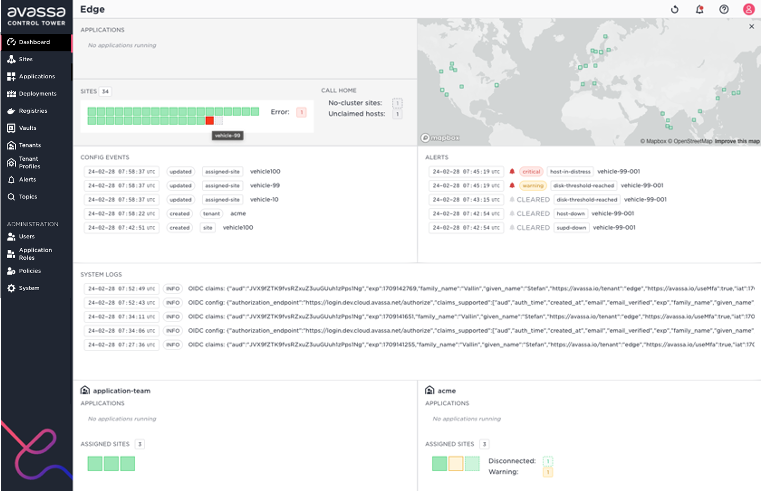
You have not deployed any applications at this point, so the top-left widget is empty.
Top right you have a miniature map view with your sites and their status.
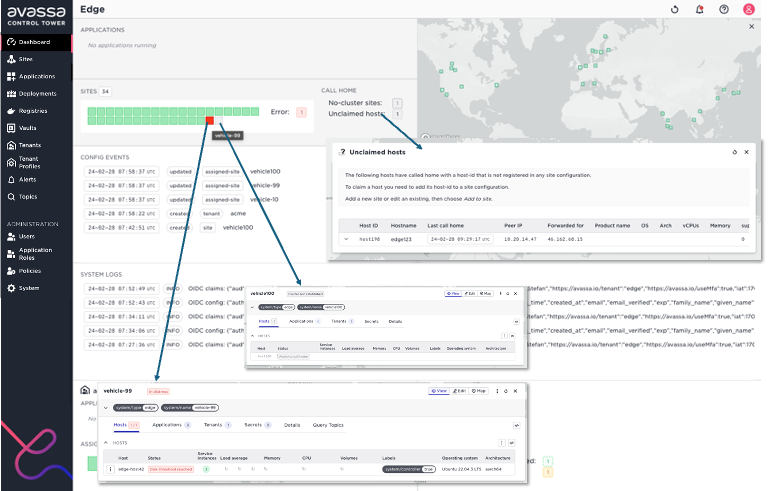
Further down the left, you get a heat map of your sites. Here, we see that one site has an error (red) status, and one site has not formed a cluster and called home yet (grey). There is also a summary of the call home status, for example, indicating that one host is calling home with a host-id not associated with a configured site. From this widget, you can drill down to inspect the details.
Below the site heat map, widgets are showing necessary logs (topics in the built-in pub/sup bus):
- Config events are configuration changes, such as sites being created or deleted. A snapshot of these log items will tell you relevant configuration changes at the edges, driven by automation tools or other operators.
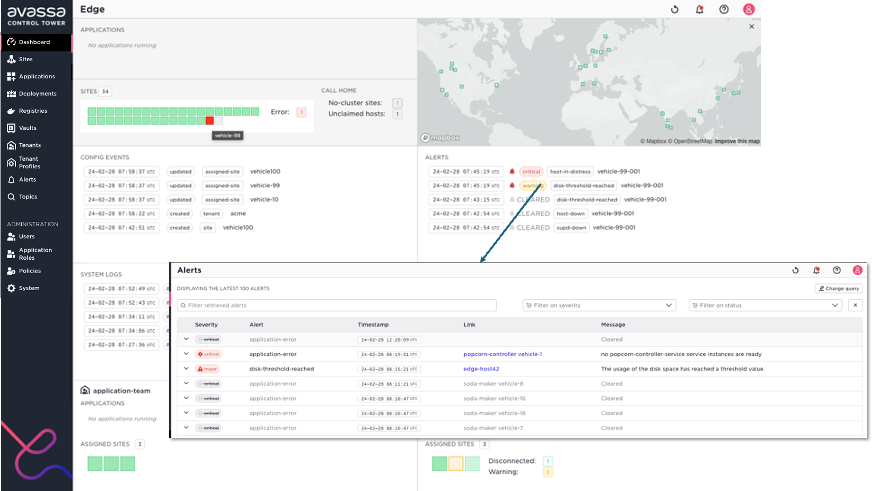
- Alerts: important alerts that should be acted upon, like edge container application failures or host failures
- System logs: Essential events in the system can be used for drill-downs and to understand what is happening at the edges.
All of these widgets have a link to get a full view of the respective logs, for example alerts as shown below:
Now let us return to the top of the dashboard and start deploying edge applications. As a site provider, the top widget will give you an overview of all running and deploying applications. The screenshot below illustrates a situation where you have deployed the popcorn-controller application at 30 sites and all are healthy. You have also deployed the soda-maker application and it is up and running at 21 sites and a rolling upgrade is ongoing.
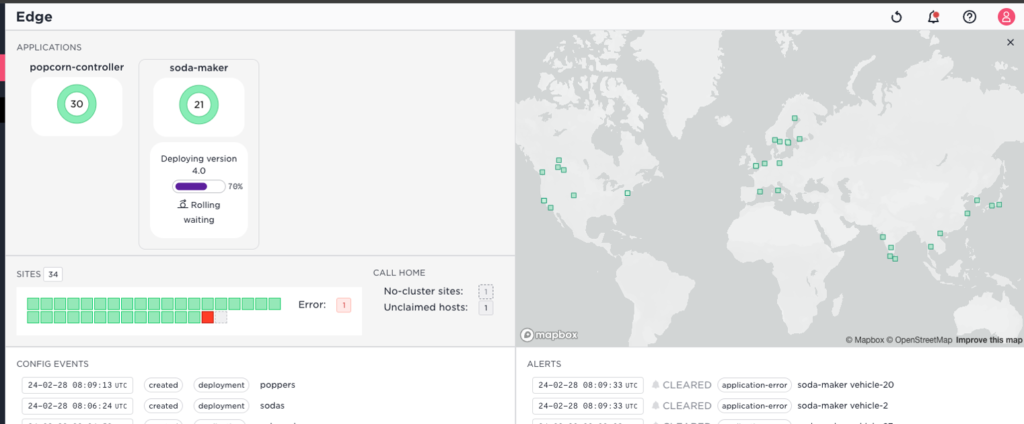
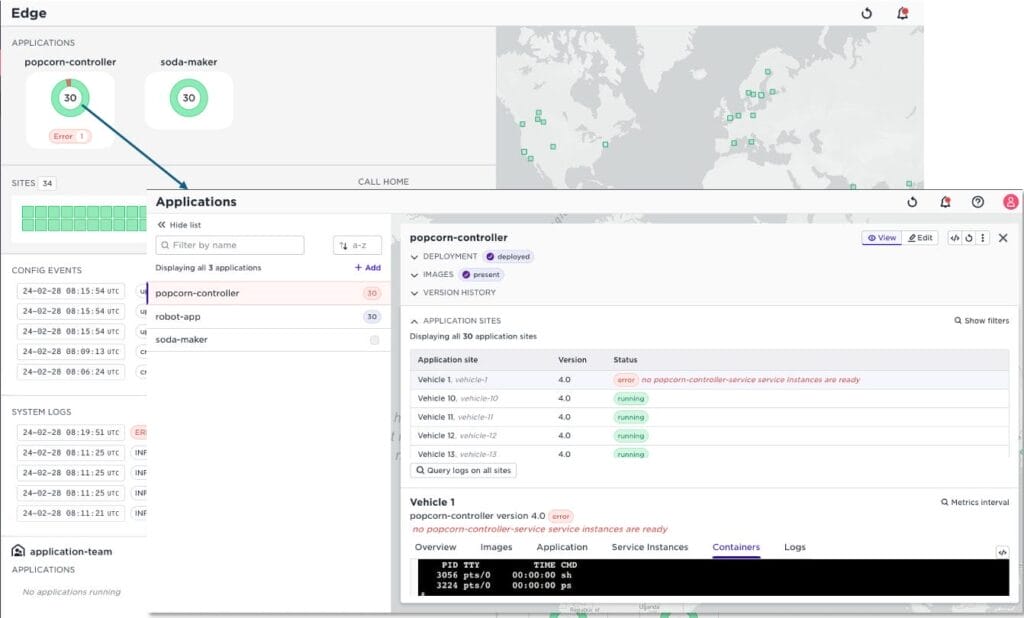
At a later point in time there is an application health issue for the popcorn-controller on one of the sites:

Directly from this view you can then drill-down to trouble-shoot the application on that site:
Finally, the dashboard also gives you insights into the health of any subtenants you have created. In this example, you have created two subtenants application-team and acme. You have assigned a subset of sites to them. The ACME tenant has deployed two applications. The bottom part of the dashboard shows a widget per tenant:
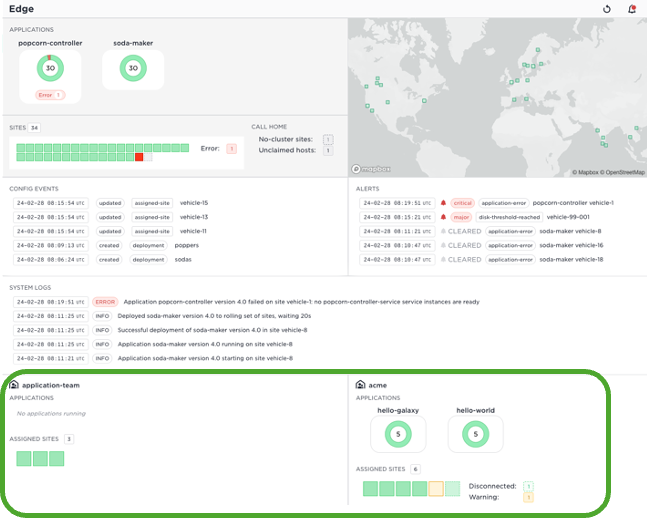
That view shows the perspective of the respective tenants, what do they see as logged in to Avassa?
- First of all, you get an overview of their deployed applications and respective health. Note that tenant isolation will not let you drill down to their applications.
- You will also see the health of the sites that are assigned to the sub-tenants. This view is more coarse-grained than the top view of the sites. Application owner tenants will not see any details of hosts and host issues. In this case, there is a warning state on one of the sites that the subtenant is aware of
Quiz: do you know where the term dashboard comes from?
Originally, the word dashboard applied to a barrier of wood or leather fixed at the front of a horse-drawn carriage or sleigh to protect the driver from mud or other debris “dashed up” […] by the horses’ hooves. The first known use of the term […] dates from 1847.
When the first “horseless carriages” were constructed […] the simple dashboard was retained to protect occupants from debris thrown up by the cars’ front wheels. However, as car design evolved to position the motor in front of the driver, the dashboard became a panel that protected vehicle occupants from the heat and oil of the engine. With gradually increasing mechanical complexity, this panel formed a convenient location for the placement of gauges and minor controls, and from this evolved the modern instrument panel, although retaining its archaic common name.
https://en.wikipedia.org/wiki/Dashboard
LET’S KEEP IN TOUCH
Sign up for our newsletter
We’ll send you occasional emails to keep you posted on updates, feature releases, and event invites, and you can opt out at any time.