How to trace Edge Applications with OpenTelemetry in the Avassa Edge Platform
Edge sites often have a set of communicating applications. An end-user transaction on the site results in a sequence of calls between the edge applications. Response times and issues vary per site. Therefore it is useful to be able to trace application calls per site.
In this blog post I will show how easy it is to deploy an application that uses OpenTelemetry (OTEL) to trace flows. This particular application is one of our demo applications, found here https://gitlab.com/avassa-public/movie-theaters-demo/.
In this short video, I walk through the steps below (spoiler alert: including the results):
OpenTelemetry for micro services
OTEL is becoming the de-facto standard for tracing calls in micro service applications. For more information on OTEL, see https://opentelemetry.io/.
The example application exposes a HTTP API which will return if the projector can be started or not:
$ curl http://192.168.3.102:22000/dune
Not allowed to start movie dune
or
Starting movie dune
The projector-operations container makes a call to digital-assets-manager to see if that particular movie is allowed to be started.
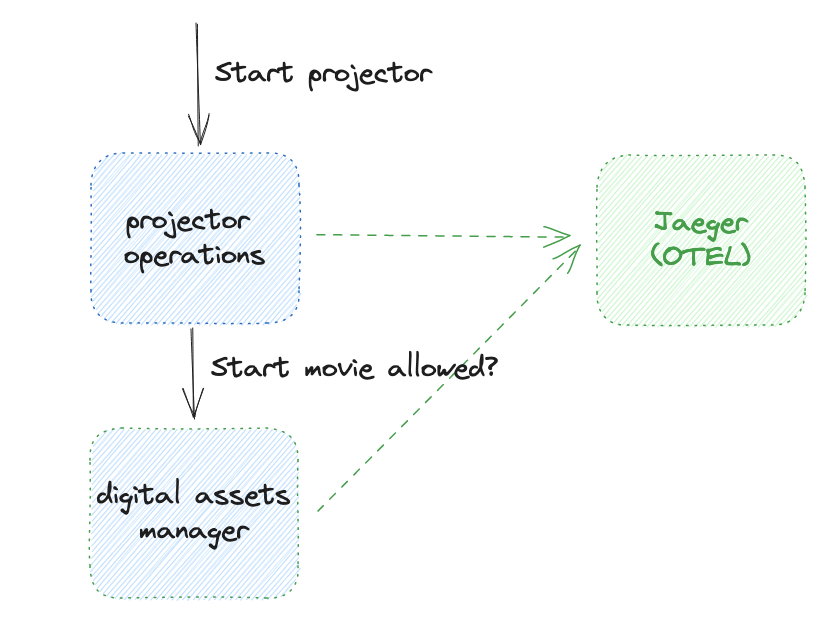
For these calls, the code utilizes OTEL to send traces to an OTEL endpoint, in this case Jaeger, another option could be e.g. Grafana Tempo.
Deploy the example application
The sample application:
NOTE: http://192.168.0.20:4317 is my jaeger instance.
OTEL_EXPORTER_OTLP_ENDPOINT is a standard environment variable used by the OTEL SDKs, see https://opentelemetry.io/docs/concepts/sdk-configuration/otlp-exporter-configuration/
name: theater-room-manager
version: "1.3"
services:
  - name: theater-operations
    mode: replicated
    replicas: 1
    volumes:
      - name: credentials
        vault-secret:
          vault: operations
          secret: credentials
          file-mode: "400"
          file-ownership: 0:0
      - name: api-cert
        config-map:
          items:
            - name: api-ca-cert.pem
              data: |
                ${SYS_API_CA_CERT}
              file-mode: "644"
              file-ownership: 0:0
    share-pid-namespace: false
    variables:
      - name: OPERATIONS_USERNAME
        value-from-vault-secret:
          vault: operations
          secret: credentials
          key: username
    containers:
      - name: projector-operations
        image: registry.gitlab.com/avassa-public/movie-theaters-demo/projector-operations:v1.0
        container-log-size: 100 MB
        container-log-archive: false
        env:
          RUST_LOG: info
          OTEL_EXPORTER_OTLP_ENDPOINT: http://192.168.0.20:4317
        on-mounted-file-change:
          restart: true
      - name: digital-assets-manager
        image: registry.gitlab.com/avassa-public/movie-theaters-demo/digital-assets-manager:v1.0
        container-log-size: 100 MB
        container-log-archive: false
        mounts:
          - volume-name: credentials
            mount-path: /credentials
          - volume-name: api-cert
            mount-path: /certs
        env:
          USERNAME: ${OPERATIONS_USERNAME}
          RUST_LOG: info
          OTEL_EXPORTER_OTLP_ENDPOINT: http://192.168.0.20:4317
          APPROLE_SECRET_ID: ${SYS_APPROLE_SECRET_ID}
          API_CA_CERT: ${SYS_API_CA_CERT}
        approle: digital-assets-manager
        on-mounted-file-change:
          restart: true
    network:
      ingress-ip-per-instance:
        protocols:
          - name: tcp
            port-ranges: "22000"
      outbound-access:
        allow-all: true
  - name: curtain-controller
    mode: replicated
    replicas: 1
    share-pid-namespace: false
    containers:
      - name: curtain-controller
        image: registry.gitlab.com/avassa-public/movie-theaters-demo/curtain-controller:v1.0
        container-log-size: 100 MB
        container-log-archive: false
        on-mounted-file-change:
          restart: true
on-mutable-variable-change: restart-service-instance
Making curl requests to the projector API at port 22000, we can see the call flow in Jaeger:
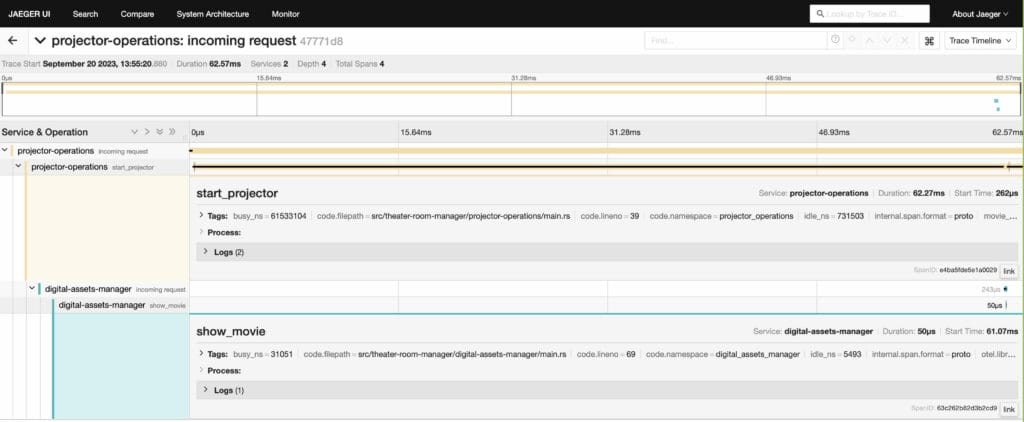
Here we can trace the incoming call, to projector-operations, and follow it into digital-assets-manager.
Deploying jaeger
This snippet below can be used to deploy an instance of jaeger all in one on an Avassa site. Navigate your browser to the ingress IP and port 16686.
name: jaeger-all-in-one
services:
  - name: jaeger
    mode: replicated
    replicas: 1
    network:
      ingress-ip-per-instance:
        protocols:
          - name: tcp
            port-ranges: 4317,14268,16686
          - name: udp
            port-ranges: 6831,6832
    volumes:
      - name: tmp
        ephemeral-volume:
          size: 20MB
          file-ownership: 1001:1001
    containers:
      - name: jaeger
        image: registry-1.docker.io/jaegertracing/all-in-one
        env:
          COLLECTOR_OTLP_ENABLED: "true"
        mounts:
          - volume-name: tmp
            mount-path: /tmp
Conclusion
Being able to trace application calls at the edge is an important operations task. In this article we have shown how easy it is to enable this by deploying a tracing component to the edges using the Avassa System. If you want to deploy your own jaeger, please see the application specification below.