Mastering audit trails: Using SQL to analyze who did what
Being able to see who did what at what time is a necessity in business-critical systems. In the Avassa Edge Platform, the audit trail log provides exactly this visibility. In this blog post, I’ll show you what’s available in the audit trail log and discuss how to consume and make practical use of that data.
What is logged in the audit trail log?
The Avassa Edge Platform logs every REST API call made by humans and applications. For PUT and POST, the payload is logged as well. Note that the audit trail contains calls made both to the Control Tower and to the Edge Enforcers. The audit trail is one of very few topics that are always propagated from the edge sites to the Control Tower (alerts is another one).
A typical log entry can look like this:
{
  "kind": "api",
  "occurred-at": "2026-02-11T07:29:34.038Z",
  "user": "test@avassa.io",
  "request-time-ms": 41,
  "path": "/v1/config/applications/mosquitto",
  "method": "PUT",
  "status": 204,
  "status-info": "No Content",
  "request-parameters": {
    "name": "mosquitto",
    "version": "1.7",
    ..
  },
  "client-ip": "10.20.16.33",
  "x-forwarded-for": "18.40.11.18",
  "site": "control-tower",
  "host": "ip-10-20-20-1",
  "tenant": "the-company",
  "token": "sbox:hashed:v1:B7nyy2ZfjyQlLpiBTNd3why5XOH8U0EROZtyOI6LkSA=",
  "accessor": "fd2c1240-9c82-4e3d-ae56-99e9982602b0",
  "user-agent": "supctl/26.2.2-c0e92a2/985519ff5ce58d558b28d7779ba93f2"
}
Here we can see the user, the API path that was invoked, and the application payload (note: truncated for brevity). This was a PUT request to /v1/config/applications/mosquitto, indicating an update to the mosquitto application configuration.
The user-agent field indicates this call was made using supctl, the Avassa command line tool.
Consuming the audit trail log
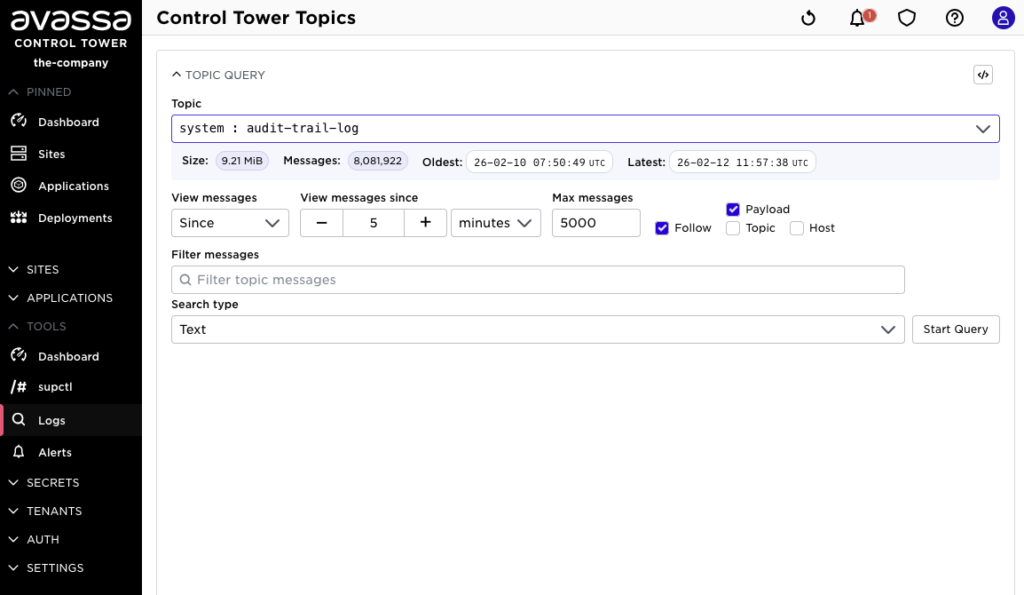
In the web UI, navigate to Logs in the left-hand menu and select system:audit-trail-log.
Or by using the supctl tool.
supctl do volga topics system:audit-trail-log consume --position-since=5m
You’ll notice that the audit trail log is extensive. Every click in the UI generates multiple events—typically GET requests, but also various POST requests for token validation and other operations.
We strongly recommend forwarding the audit trail log to an external tool for analysis. The forwarding itself is straightforward to set up using web hooks (https://docs.avassa.io/how-to/volga-webhooks) or by consuming this topic with your own code (https://docs.avassa.io/fundamentals/volga#consuming).
Making sense of the messages
Every message in the audit trail log is a structured JSON object (https://docs.avassa.io/reference/volga-topics#topic-systemaudit-trail-log).
To demonstrate practical usage, I wrote code that consumes this topic and stores it in a PostgreSQL database.
In my demo project, I parsed the audit log messages and stored certificate issuance messages in a dedicated table.
{
  "kind": "certificate",
  "occurred-at": "2026-02-04T09:53:15.976Z",
  "user": "test@avassa.io",
  "site": "robot-cluster",
  "issuing-ca": "mosquitto",
  "ca-version": 1,
  "from-auto-cert": {
    "vault": "mosquitto",
    "secret": "cert"
  },
  "properties": {
    "certificate-type": "server",
    "host": "mosquitto",
    "serial": "59:8e:ef:38:30:41:fc:f0:7d:5f:f9:19:32:17:f6:d3:a2:02",
    "expires": "2026-03-04T09:53:15.000000Z"
  },
  "certificate": "-----BEGIN CERTIFICATE-----\nMIIDYjCCAkygAwIBAgISWY7vODBB/PB9X/kZMhf206ICMAsG
}
This allows me to easily query for all non-expired certificates:
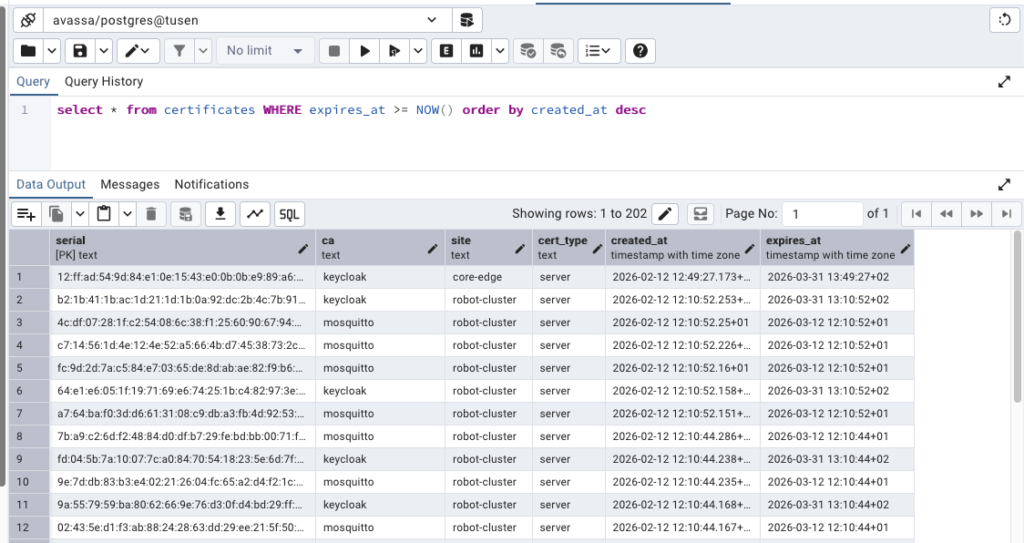
PostgreSQL has excellent support for JSON objects, so for other message types I simply store the entire JSON payload as a field. For example, to retrieve the latest 30 PUT requests made by a specific user:
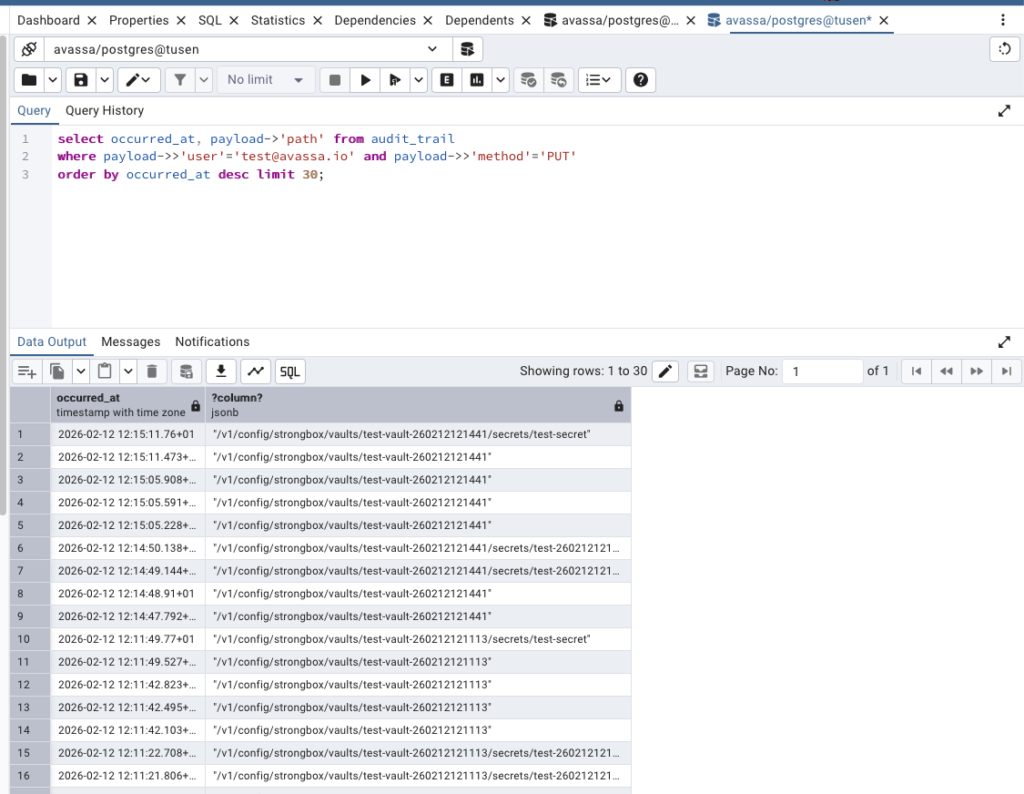
The payload->>'user' syntax reaches into the JSON payload and matches on the user field.
Other topics to capture and monitor
The audit trail log captures only actions made by authenticated users. Another valuable topic to monitor is system:alerts, which logs security events such as failed login attempts:
{
  "alert": "failed-login-attempts",
  "time": "2026-02-10T08:24:01.089Z",
  "id": "failed-login-attempts/control-tower/jb@avassa.io",
  "site": "control-tower",
  "kind": "security",
  "severity": "critical",
  "description": "Failure login attempts. This may be an indication of an attempted security breach.",
  "expiry-time": "2026-02-11T08:24:01.089Z",
  "cleared": false,
  "data": {
    "username": "test@avassa.io",
    "attempts": 3,
    "peer-ip": "10.20.36.6",
    "x-forwarded-for": [
      "84.19.145.194"
    ]
  }
}
Yet another topic is system:unauthenticated-audit-trail-log, here you will find any event that is done by someone that is not authenticated. For example when a refresh for a non valid token is made:
{
  "kind": "api",
  "occurred-at": "2026-02-16T13:42:20.437Z",
  "request-time-ms": 5,
  "path": "/v1/state/strongbox/token/refresh",
  "method": "POST",
  "status": 401,
  "status-info": "Unauthorized (RFC 7235)",
  "client-ip": "172.18.255.2",
  "site": "control-tower",
  "host": "ip-10-20-20-1"
}
For further reading, there is a whole list of interesting topics to read up on in the documentation.
Conclusion
The Avassa Edge Platform’s audit trail logging provides comprehensive visibility into every action taken within your system. By capturing detailed information about API calls, certificate issuances, and security events, you gain the transparency needed for compliance, troubleshooting, and security monitoring in business-critical environments.
In this post, we’ve shown how easy it is to access audit trail data through both the UI and command line tools, and demonstrated practical ways to make this data actionable by forwarding it to external systems like PostgreSQL. With structured JSON messages and rich metadata including user identity, timestamps, request details, and client information, you have everything needed to answer the critical questions: who did what, and when.
The combination of the audit trail log and system alerts topics gives you a complete picture of both authenticated actions and potential security concerns. Whether you’re investigating an incident, preparing for an audit, or simply maintaining operational awareness, these logs are invaluable assets that transform raw system activity into meaningful insights.