Sending Avassa Edge Platform Alerts to Grafana via Prometheus Pushgateway
Monitoring distributed edge systems efficiently is essential for maintaining reliability and performance. The Avassa Edge Platform provides flexible alerting capabilities that can notify you when important events occur across your edge fleet. In this guide, we’ll demonstrate how to forward Avassa alerts to Grafana for visualization, using a lightweight Python bridge and Prometheus Pushgateway.
Overview
We’ll build a simple flow that connects Avassa’s alert webhooks to Grafana dashboards:
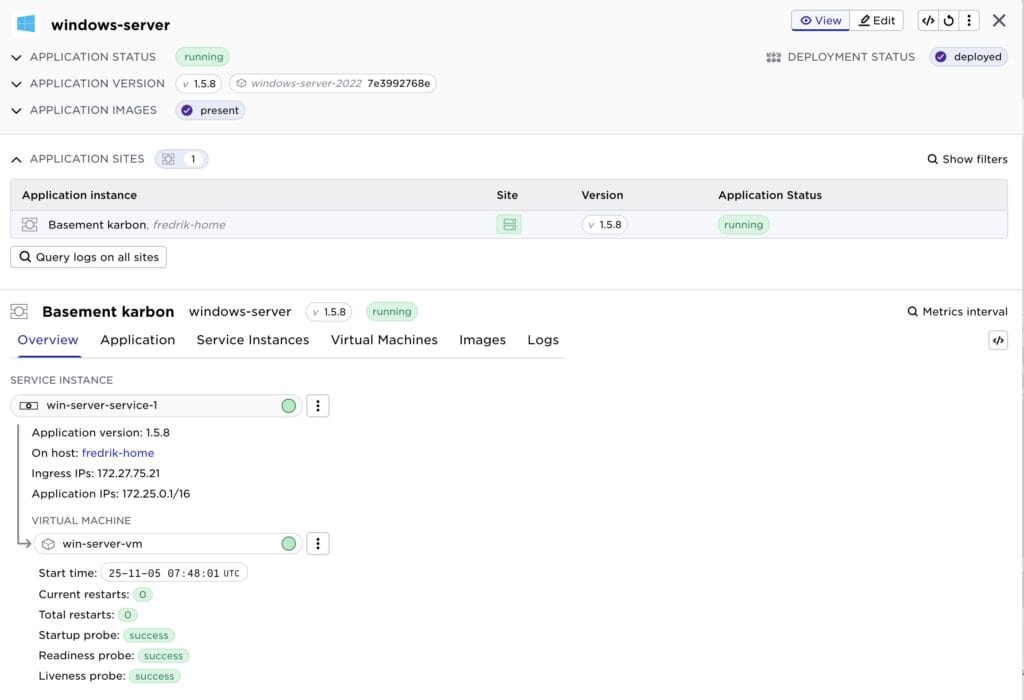
- Avassa Edge Platform/Control Tower – sends alerts (raise and clear) via webhooks when important events occur that need operator attention.
- “Alert to Webhook” – receives the webhook payload, parses the alert, and pushes metrics to Prometheus Pushgateway.
- Prometheus – scrapes metrics from the Pushgateway and stores them.
- Grafana – visualizes alerts using Prometheus as a data source.
Prerequisites
To follow along, you’ll need:
- An Avassa Edge Platform instance
- A Prometheus instance with access to a Pushgateway.
- A Grafana instance connected to Prometheus.
Step 1: Configure Avassa Alerts via Webhook
Install the Avassa Edge Platform Volga Webhook container [1].
I configured the webhook application to forward the system:alerts and system:site-alerts topics.
name: alert-forwarder
services:
  - name: volga-webhooks-srv
    mode: replicated
    replicas: 1
    volumes:
      - name: volga-webhooks-conf
        config-map:
          items:
            - name: volga-webhooks.conf
              data: |
                webhooks:
                  - name: alerts
                    topic: system:alerts
                    location: parent
                    url: "${WEBHOOK_URL}"
                    headers:
                      - key: Content-Type
                        value: application/json
                  - name: site-alerts
                    topic: system:site-alerts
                    location: parent
                    url: "${WEBHOOK_URL}"
                    headers:
                      - key: Content-Type
                        value: application/json
              file-mode: "644"
              file-ownership: 0:0
    share-pid-namespace: false
    variables:
      - name: WEBHOOK_URL
        value: "https://<Your endpoint here>/webhook"
    containers:
      - name: volga-webhooks
        mounts:
          - volume-name: volga-webhooks-conf
            files:
              - name: volga-webhooks.conf
                mount-path: /volga-webhooks/volga-webhooks.conf
        container-log-size: 100 MB
        container-log-archive: false
        shutdown-timeout: 10s
        image: registry.gitlab.com/avassa-public/volga-webhooks
        env:
          APPROLE_SECRET_ID: ${SYS_APPROLE_SECRET_ID}
          API_CA_CERT: ${SYS_API_CA_CERT}
        approle: volga-webhooks
        on-mounted-file-change:
          restart: true
    network:
      outbound-access:
        allow-all: true
on-mutable-variable-change: restart-service-instance
Step 2: Python Bridge for Forwarding Alerts
Below is a minimal example of a Python script using Flask to receive alerts and forward them to Prometheus Pushgateway.
#!/usr/bin/env python3
"""
Quick start
-----------
$ uv run main.py

Environment variables
---------------------
- LISTEN_HOST (default 0.0.0.0)
- LISTEN_PORT (default 5000)
- PROMETHEUS_PUSHGATEWAY (default <http://localhost:9091>)
"""

from __future__ import annotations
import json
import logging
import os
import time
from typing import Any

from prometheus_client import CollectorRegistry, Gauge, push_to_gateway

from flask import Flask, request, jsonify

# ---------------------------
# Configuration
# ---------------------------
LISTEN_HOST = os.getenv("LISTEN_HOST", "0.0.0.0")
LISTEN_PORT = int(os.getenv("LISTEN_PORT", "5000"))
PUSHGATEWAY = os.getenv("PROMETHEUS_PUSHGATEWAY", "<http://localhost:9091>")

app = Flask(__name__)
logging.basicConfig(level=logging.INFO,
                    format="%(asctime)s %(levelname)s %(message)s")
logger = logging.getLogger("avassa-prometheus-alerts")

collector_registry = CollectorRegistry()
alert_gauge = Gauge('avassa_alert',
                    'Avassa Alert',
                    registry=collector_registry,
                    labelnames=['id', 'kind', 'severity', 'alert', 'site'])

def send_to_prometheus(msg: dict[str, Any]) -> None:
    print(json.dumps(msg, indent=2))
    if 'kind' not in msg:
        return
    alert = 0 if bool(msg.get('cleared')) else 1
    alert_gauge.labels(
        id=msg['id'],
        kind=msg['kind'],
        severity=msg['severity'],
        site=msg['site'],
        alert=msg['alert']) \
        .set(alert)

    push_to_gateway(PUSHGATEWAY, job='avassa', registry=collector_registry)

@app.route("/healthz")
def health() -> Any:
    return jsonify({"ok": True, "time": int(time.time())})

@app.route("/webhook", methods=["POST"])
def webhook() -> Any:
    raw = request.get_data()
    try:
        payload = json.loads(raw)
    except Exception as e:
        logger.error(f"invalid JSON payload: {e}")
        return jsonify({"error": "invalid JSON"}), 400

    send_to_prometheus(payload)

    return jsonify({"accepted": True}), 202

# ---------------------------
# Main
# ---------------------------
def main():
    logger.info("Starting Webhook Bridge on %s:%s",
                LISTEN_HOST, LISTEN_PORT)
    app.run(host=LISTEN_HOST, port=LISTEN_PORT)

if __name__ == "__main__":
    try:
        main()
    except KeyboardInterrupt:
        pass
An example of an Avassa alert
{
  "alert": "host-in-distress",
  "time": "2025-11-06T11:28:24.888Z",
  "id": "host-in-distress/robot-cluster/robot-cluster-001",
  "site": "robot-cluster",
  "kind": "infrastructure",
  "severity": "critical",
  "description": "Host in distress.",
  "expiry-time": "2025-11-07T11:28:24.888Z",
  "cleared": false,
  "data": {
    "cluster-hostname": "robot-cluster-001",
    "hostname": "stockholm-1",
    "distress": "disk-threshold-reached",
    "distress-info": "The level of disk usage has put the host in distress."
  }
}
This script:
- Receives webhook data from the Avassa Edge Platform
- Converts it into a Prometheus metric.
- In Prometheus
0represents a cleared alert and1represents an active alert. - Prometheus doesn’t have a concept of a single id for a metric, rather all label values correlates a metric value. We therefore have to be a bit careful when sending the data to Prometheus, i.e. only send labels/values that are consistent between raise and clear events. For example, we don’t send the error message to Prometheus.
- In Prometheus
- Pushes it to the Pushgateway with context labels (site, application, severity).
Step 3: Prometheus Configuration
In your Prometheus configuration (prometheus.yml), add the Pushgateway as a scrape target:
scrape_configs:
  - job_name: "pushgateway"
    static_configs:
      - targets: ["pushgateway:9091"]
Restart Prometheus, and it will begin scraping the metrics pushed by the Python bridge.
Step 4: Visualize in Grafana
In Grafana:
- Add Prometheus as a data source (if not already done).
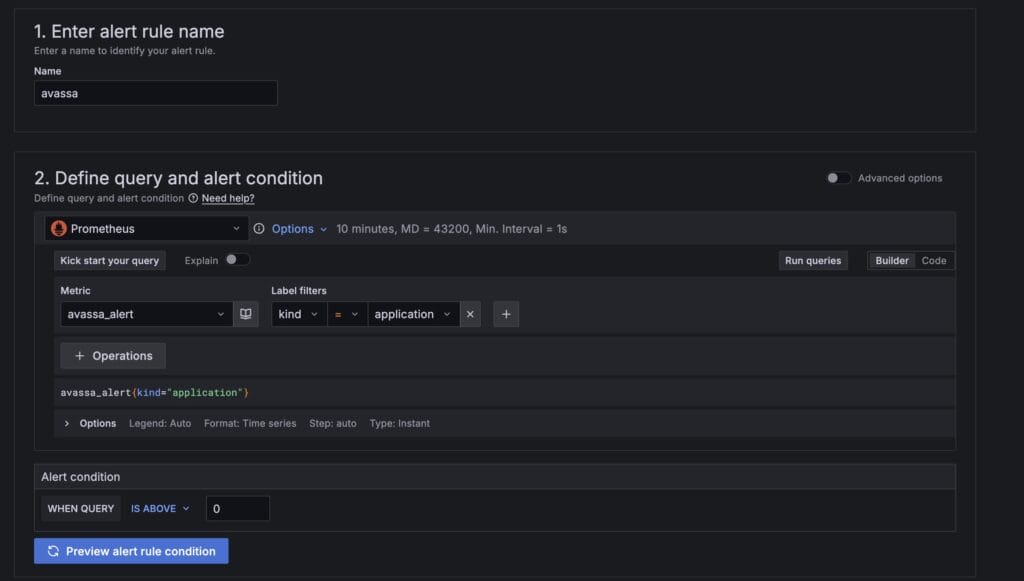
- Create an Alert rule
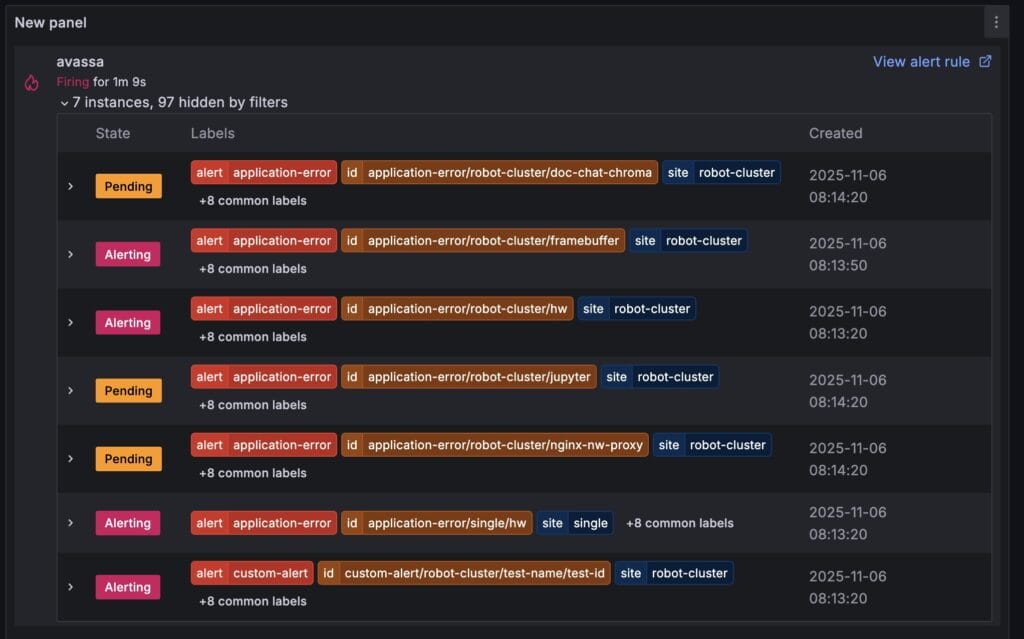
- Create a new dashboard and panel and include the alerts.
Conclusion
By combining Avassa’s flexible webhook alerts with Prometheus and Grafana, you can create a powerful, observable alerting pipeline.
This architecture allows you to visualize system health across your entire edge fleet — from local sites to the control plane — with minimal infrastructure and code.